Adaptive Planning in Large Unstructured Environments with Correlated Traversability Costs
Paper currently under review to appear in the Robotics and Automation Letters (RA-L) and to be presented at the International Conference on Robotics and Automation (ICRA 2022).
Supplementary material: simulated kilometre-long rover traverse using orbital maps of Jezero Crater, Mars
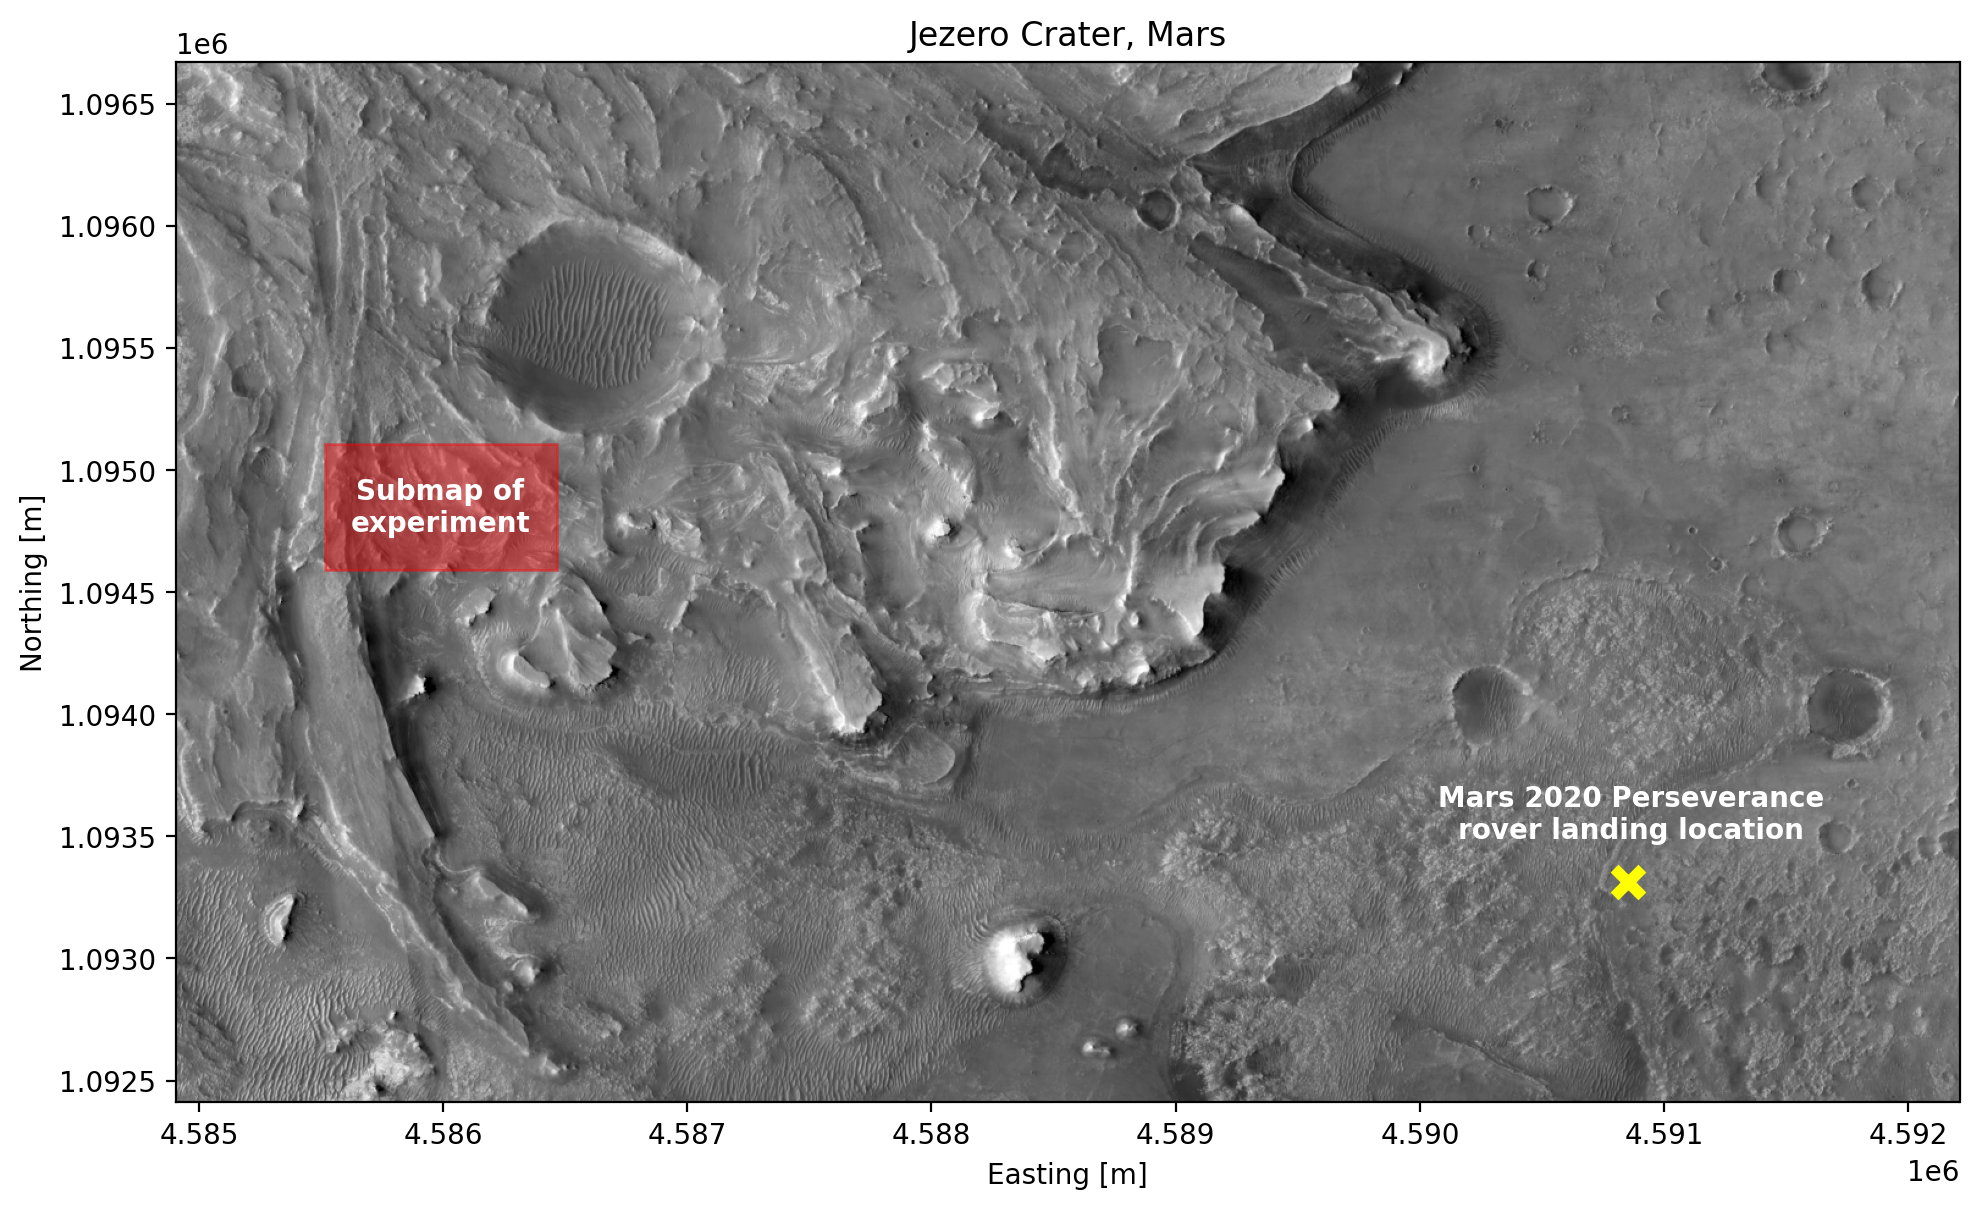
We test our adaptive traversal framework using real orbital maps of Jezero Crater, on Mars. This is where NASA’s Mars 2020 Perseverance rover has landed in February 2021. The following grayscale map spans a surface area of 7.3 kilometres by 4.2 kilometres and has a resolution of 5 metres per pixel. The region used for the current experiment is shaded in red and the Perseverance rover landing location is indicated in yellow for reference.
The paper we submitted presents two distinct experiments on simulated field environments. Here, we replicate the second experiment, now using a stochastic graph derived from real orbital data. For clarity, we describe again the experiment setup. We also add a few notes about the realism of our assumptions and what could be done differently in follow-on work from an application perspective.
Experiment setup
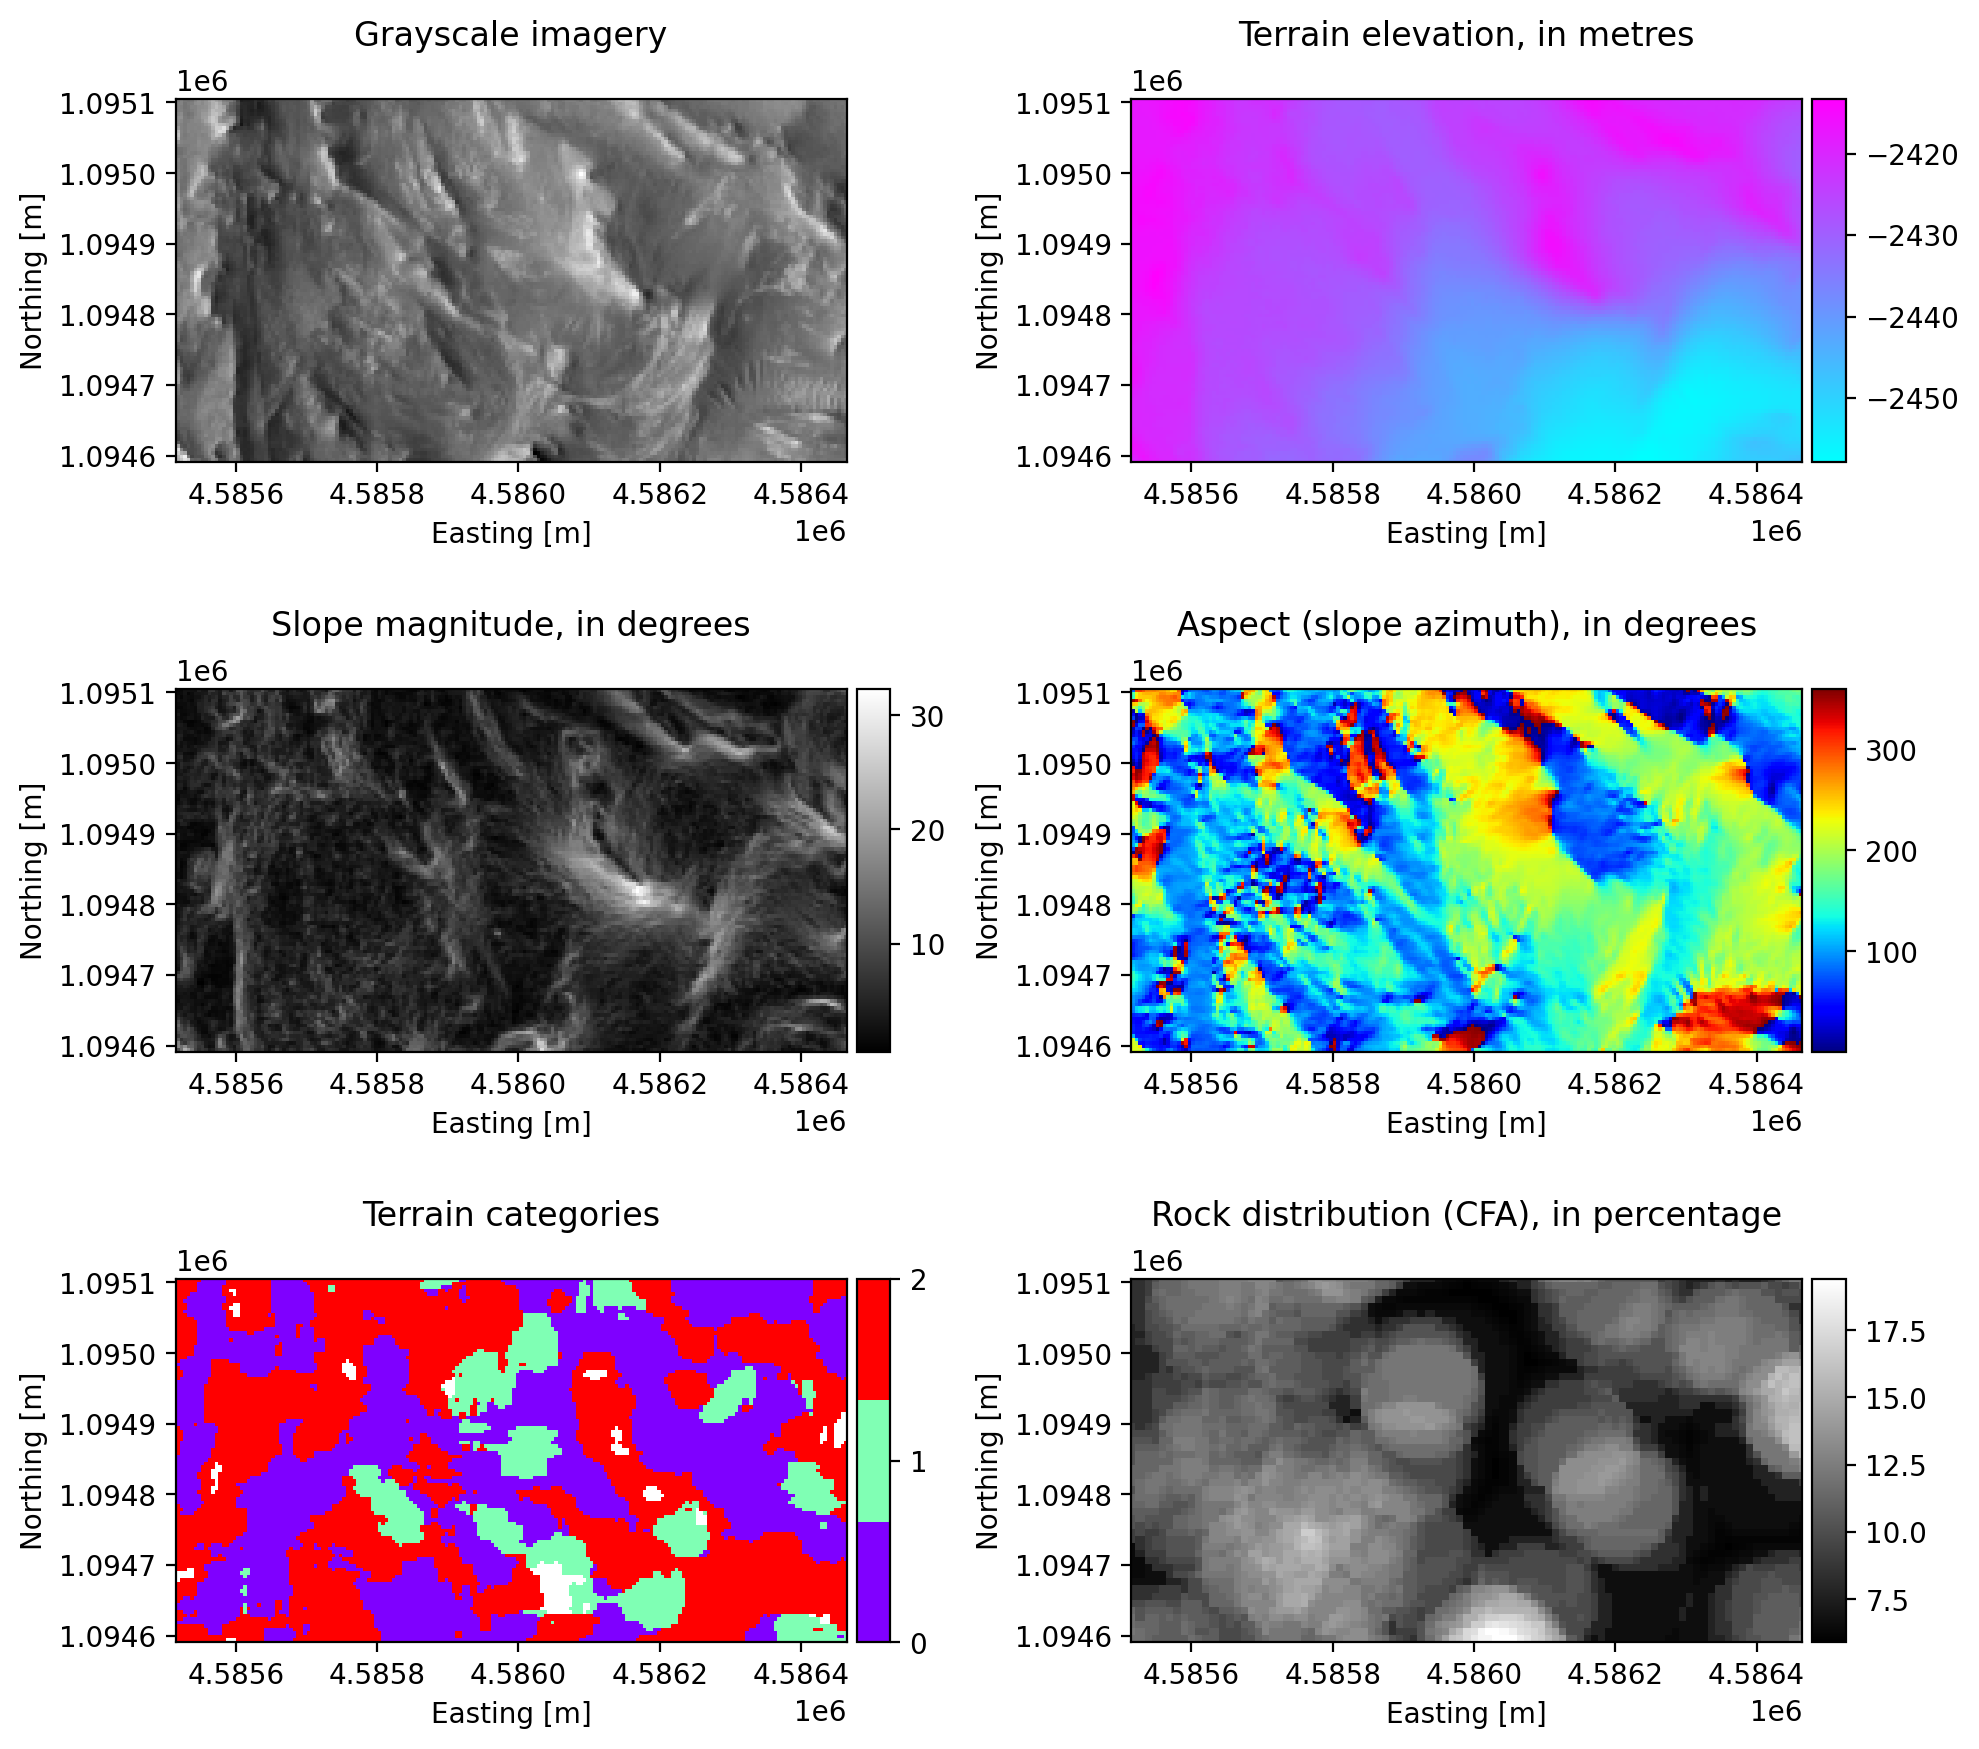
In this experiment, the global submaps of the red region above are derived from two raw data products: grayscale imagery and an elevation model (shown in the first row of plots below). Numerous data products can be generated from these raw maps: slope magnitude, slope orientation (aspect, or azimuth from North), rock abundance (Cumulative Fractional Area, or CFA) and three classes of terrain categories derived from the SPOC Terrain classifier. In our case, class 0 is a cluster of simpler cohesive terrains, class 1 is a cluster of harder terrain labels (ex: bedrock) and class 2 groups loose terrain types (ex: sand). Not shown here is a binary mask of dangerous/obstacle regions to avoid. This mask combines map pixels with an invalid terrain label, slopes steeper than 30 degrees and other human-labelled areas that we generated ourselves.
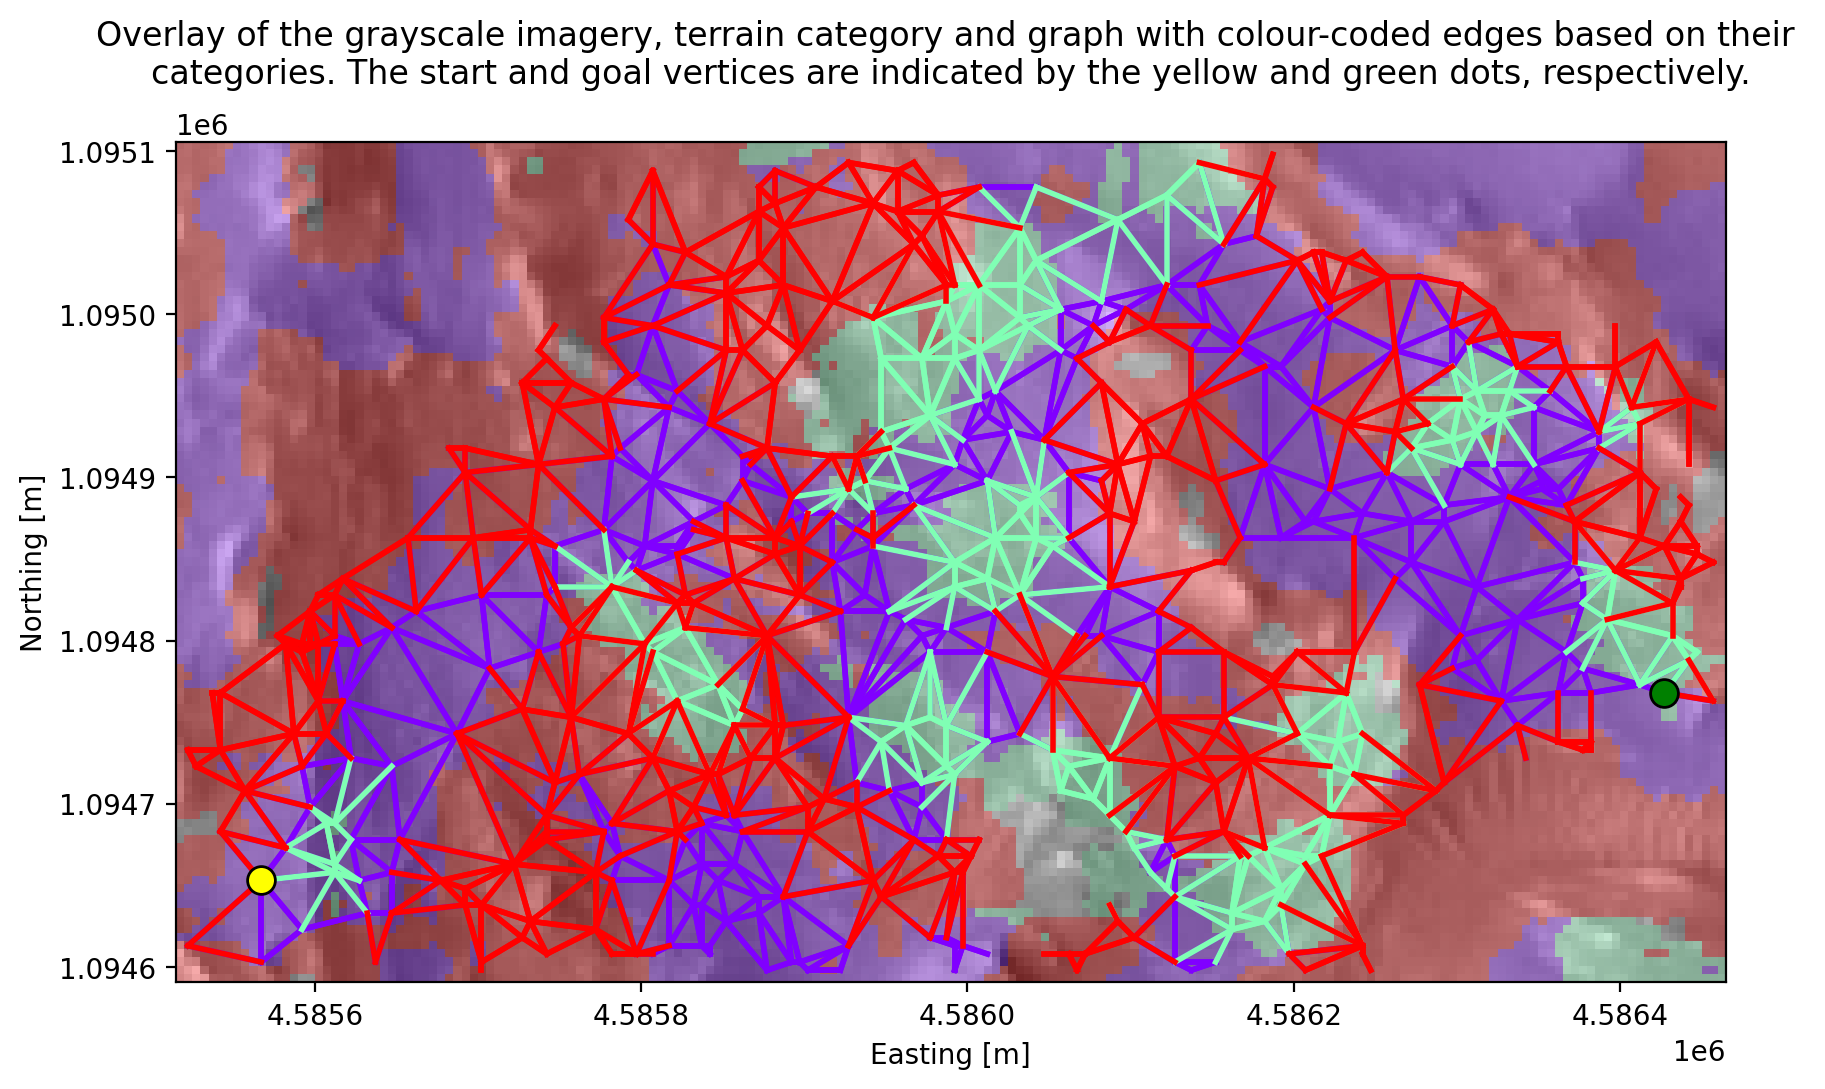
We begin by constructing a directed graph across the space outside of the dangerous/obstacle regions. We randomly sample vertex locations and connect them according to their Voronoi neighbourhood (we calculate the Voronoi diagram of all vertices and connect those with neighbouring cells using two directed edges if they do not cross an obstacle region). Every edge is assigned a categorical feature, which is one of the three terrain classes that their originating vertices are located in. Every edge is also described by a vector of (normalized) continuous features, which in our case are the rover’s pitch, roll and the rock abundance along those edges.
Note that this graph construction methodology is enough for preliminary demonstrations of our algorithm’s capabilities but in reality, a lot more effort should go into identifying possible routes that rovers could follow from orbital data. Regions that have more diverse terrain types and topography should have a higher spatial concentration of vertices to produce trajectories that are locally more detailed than for other, more homogeneous terrain regions. Choosing the right physical graph layout is beyond the scope of this work, but we emphasize that every edge of the graph must be described by the underlying terrain features along it to later estimate traversability cost correlations between all edges.
In this example, the graph has a total of 522 vertices and 2668 edges:
Similar to the second experiment presented in our paper, the ground-truth cost function per unit length of every edge category (which is unknown to the rover) is defined with different instances of Perlin noise over the continuous edge feature space and scaled to specific cost ranges. One octave is used, which generates a cost function that varies smoothly over the continuous edge feature space and hence mimics medium cost correlations between edges of the same category sharing a similar feature vector.
Once again, we define a Gaussian Process regressor for each edge category (three in this case). Each is defined by a constant mean function and a radial basis function (RBF) kernel. The range in the ground-truth cost functions per unit distance and the parametrization of each GP regressor are outlined in the table below.
| Edge category | 1 (purple) | 2 (turquoise) | 3 (red) |
|---|---|---|---|
| True cost range per unit length | [45,65] | [15,45] | [65,95] |
| Constant mean function value | 50 | 70 | 70 |
| RBF kernel variance | 52 | 402 | 402 |
| RBF kernel lenghtscale (Poor correlation assumption) | 0.3 | 0.05 | 0.05 |
| RBF kernel lenghtscale (Medium correlation assumption) | 0.3 | 0.5 | 0.5 |
In a real rover traverse context, the type of kernel function, mean function and their parametrization would come from prior expert knowledge based on previous navigation events. Additionally, the reference ground-truth cost of every edge would probably be more monotonic (i.e. smoothly increase or decrease along each continuous edge feature). For instance, the traversability cost should be expected to only increase with increasing rover pitch, and only decrease with increasing rock abundance (CFA). This prior knowledge can be captured with more representative kernel functions (e.g. a combined linear and RBF kernel) and conditioning this prior over costs observed in previous (but recent) navigation events. Here, for simplicity, we do not enforce such a monoticity in traversability cost variations. We do however employ a smoothly-varying ground-truth cost function and kernel functions that capture correlations between edges, which is the focus of this experiment.
In this experiment, the prior belief over the edge costs in terrain category 1 is conditioned on the observation of 10 random edges from this category to simulate data collected during a previous traverse. Categories 2 (turqoise) and 3 (red), on the other hand, are highly unknown to the robot at first and share the same prior probability distribution. In reality, the ground-truth costs of the turquoise edges are lower than the purple ones and the red edges have a significantly higher cost. A zero-mean Gaussian noise with a variance of 1 per unit length is added to every edge observation.
Two batches of adaptive stochastic graph traverses are carried out, each being executed on the exact same graph with the same prior information and between the same start and goal vertices. The only difference is that in one instance, the rover assumes poor correlations among the turquoise and red edges, characterized by a low kernel lengthscale parameter. In the other instance, the rover considers medium correlations in the environment by employing a larger lengthscale parameter (which is more representative of the ground-truth cost function). These lengthscale values are shown in the table above. In both instances, the purple terrain (category 1) has the same lengthscale parameter and is less uncertain than the other terrain categories. For each instance, traverses with the same reliability coefficient (lambda = 3), the same number of graph sampling iterations (Omega1=400, Omega2=1000) but different gamma parameters (between 0 and 2000) are executed.
Results and brief discussion
Each planning configuration on each of the two problem instances is repeated 3 times and the actual total traverse cost for each gamma value is recorded. The following plot shows the average total traverse cost incurred by each gamma configuration on the problem instance assuming poorly correlated costs in turquoise and red terrain (blue line) and the one assuming medium cost correlations (orange line):
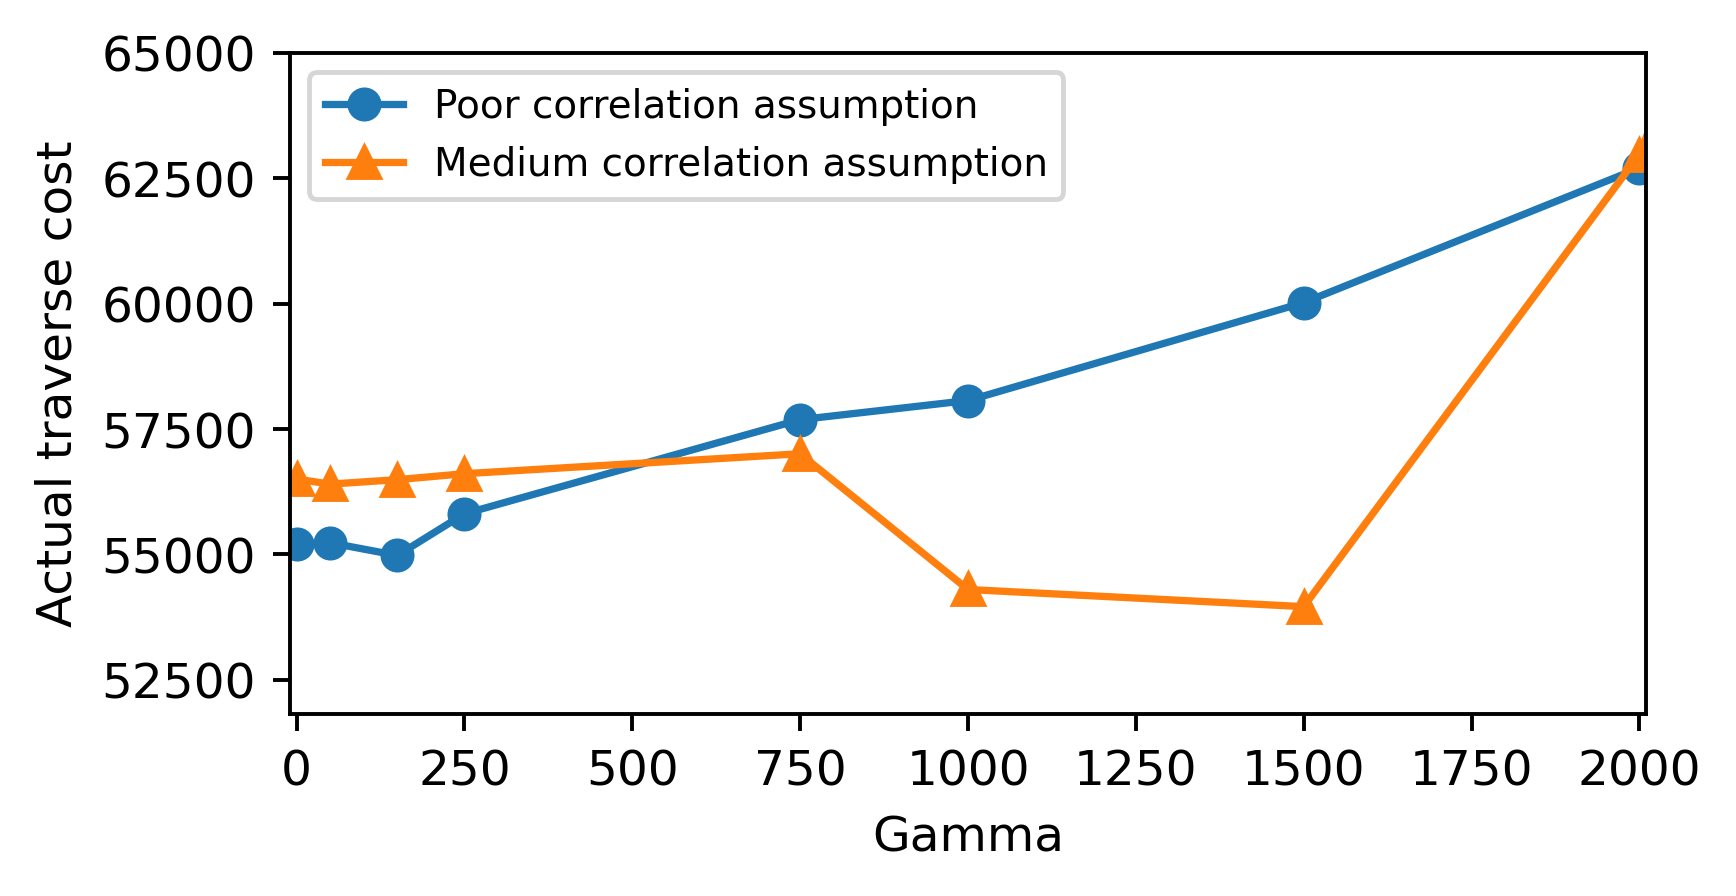
Interestingly, we observe a similar pattern to the second experiment results presented in the paper. Fow low gamma values, the weight on plan reliability is relatively higher than plan informativeness. In those instances, the (more confident) purple terrain is prioritized for most of the traverse, but leads to longer traverses that have an approximately similar cost for both the poor and medium correlation traverse instances. However, for larger gamma values, mutual information has more weight. As such, the traverses venture more in unknown regions. In the poor correlation assumption case (blue curve), the rover poorly uses the knowledge of previous edge cost observations to prepare subsequent plans, leading to poor traverse performance. This is exacerbated by the fact that an assumption of low correlation between edge traverse costs reduces the amount of information acquired by observing an edge and slows down information gathering, causing long traverses. On the other hand, the medium correlation assumption case (orange curve) shows better performance over a certain range of gamma values thanks to a more appropriate weighing of plan reliability and informativeness specific to this problem. However, as one might expect, too much weight on information gathering (very large gamma) will eventually lead to suboptimal traverses in this case too, as shown by the rise in the orange curve for gamma = 2000.
As an example, we plot two traverses for the gamma = 1500 case. The blue one is the lowest-cost (i.e. best) traverse from the poor correlation assumption instance with this gamma value, and the orange trajectory is the best traverse from the medium correlation assumption instance with this gamma value:
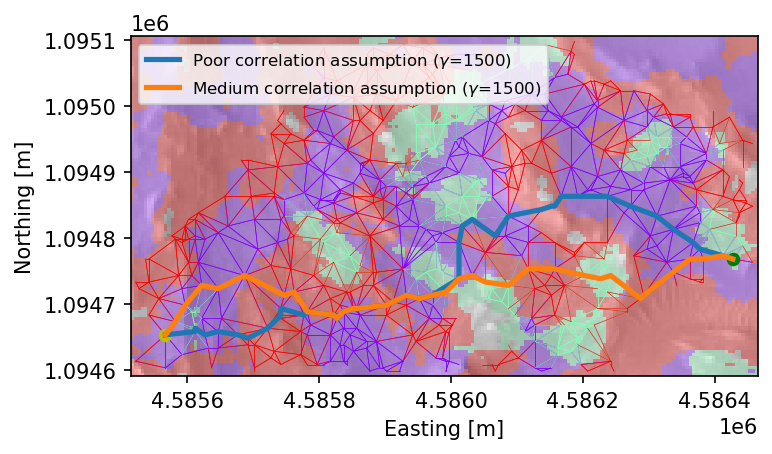
We can see how, in the medium correlation assumption case (orange trajectory), the rover takes advantage of the information gained by traversing the turquoise terrain in the center of the map, and finds better trajectories that prioritize similar edge configurations until the goal is reached. In the poor correlation assumption case (blue trajectory), on the other hand, the rover fails to properly use the information gathered by traversing the same region in the center of the map and traverses the environment in a suboptimal manner.
This experiment on real orbital data of Mars demonstrates similar adaptive traverse behaviors to those shown in the paper: when reliably traversing an uncertain environment with correlated traversability costs, ignoring such correlations can lead to suboptimal traverse performance. Additionally, considering these correlations alone is not enough; some amount of information gathering can be necessary to improve traverse performance.
Implications of our algorithm on planetary navigation safety
Historically, there has been a stronger reliance on exteroceptive-based terrain traversability assesment (for example, observing an unknown terrain configuration up close without traversing it) as opposed to proprioceptive sensing (i.e. actually traversing unknown terrain). Although the latter provides more accurate terrain cost information, prioritizing the former was obviously necessary to keep rovers as safe as possible and avoiding entrapment.
Our adaptive planning approach currently assumes proprioceptive-based traverse cost measurements, but extensions to exteroceptive sensing (for example, observing an edge cost by visiting one of its end vertices) can be easily implemented. In reality, we believe that both exteroceptive and proprioceptive sensing should be considered when autonomously traversing unknown environments. Such a technique, however, should only be implemented on rovers equipped with backup mobility modes to get out of entrapments, such as the ExoMars Rosalind Franlkin rover or legged planetary rovers.